An empirical method for estimating source vicinity ground-motion levels of inland crustal earthquakes with sources difficult to identify in advance
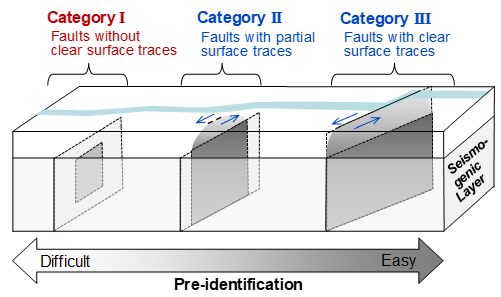
Earthquakes that cause significant damage because of strong motion are mainly classified into those that occur around plate boundaries and in shallow areas of continents. In the latter, that is, inland crustal earthquakes, there are seismic sources that are relatively easy or difficult to identify in advance by detailed surveys for surface traces of active faults. They can be classified into three main categories according to the appearance of the surface traces, as shown in Figure 1.
In this study[1], we targeted inland crustal earthquakes with sources difficult to pre-identify (Mw ≲ 6.5 in Japan) which is Category I in Figure 1. Their fault rupture areas remain inside the seismogenic layer and they have no surface trace appears. Therefore, future earthquakes might be overlooked when we only rely on the investigation of the surface traces, and it might also be difficult to treat them as scenario earthquakes.
For such earthquakes, we assumed that it is possible to uniformly evaluate ground-motion levels in the regions where seismogenic conditions are similar. Under the assumption, we developed a technique to estimate probability density functions of source vicinity strong motion on hard bedrock (Vs ≈ 2000–3000 m/s) using the observation record group and to calculate the response spectra corresponding to non-exceedance probabilities (NEPs). We then developed an empirical method to estimate how much annual exceedance probability (AEP) corresponds to the NEP spectral level by considering the annual occurrence frequency of the target event group.
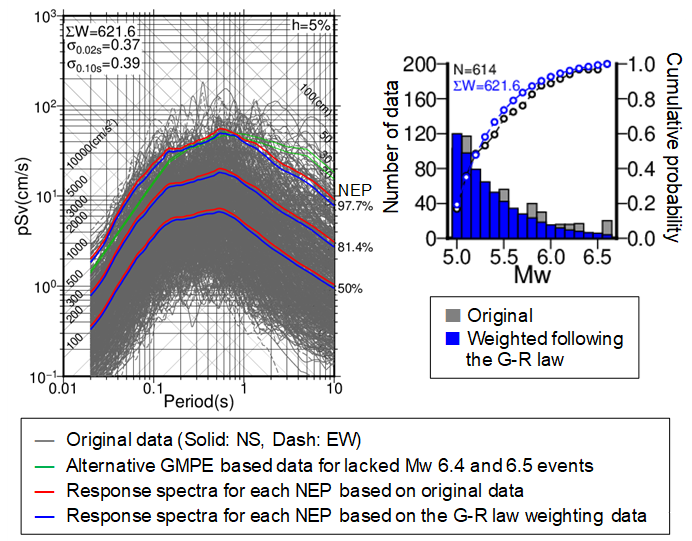
Moreover, we applied this approach to all over Japan, where a large number of downhole records on stiff baserock (Vs ≈ 700–3000 m/s) have been obtained by the dense nationwide network of vertical array stations, NIED KiK-net, at the ground surface and downhole. We analyzed adjusted ground-motionrecords (a total of 614 horizontal records and 304 vertical records) from 89 inland earthquakes with Mw 5.0–6.6, and estimated the NEP spectral levels as shown in Figure 2. We then demonstrated that the empirical AEP spectral level using our method is consistent with AEP response spectra (so-called uniform hazard spectra) derived from PSHA using the kinematic fault rupture modeling method in a previous study[2]. Based on the ground-motion levels of NEP 97.7% response spectra of multiple cases in this study, the “study team on evaluation for ground-motions without identification of seismic sources” of the Nuclear Regulation Authority, Japan (NRA) developed the “standard response spectrum” for the “ground-motions without identification of seismic sources,” which are applied uniformly throughout Japan. Then, the NRA incorporated the standard spectrum into its regulatory requirements in April 2021.
Our approach is useful for evaluating earthquakes whose sources are difficult to identify in advance and for verifying the AEP response spectra obtained by PSHA, although accumulating more data and improving the analysis accuracy in the future are important because they depend on observation records.
[1] R. Tajima, et al., Bulletin of the Seismological Society of America, 111, 5, 2408-2425, (2021).
[2] Japan Nuclear Energy Safety Organization, Annual Safety Research Report, JFY 2011, JNES-RE-2012-0001-Rev.2, 79-88, (2012).
Reiko Tajima
Nuclear Regulation Authority (NRA)
tajima_reiko_i3z@nra.go.jp