Experimental and numerical assessment of Natural Circulation Interruption phenomena
1 INTRODUCTION
In the framework of the OECD/NEA PKL projects [1], Bel V proposed to perform a series of experimental tests connected with the Natural Circulation Interruption (NCI) issue. The objective was to assess the natural circulation interruption phenomena under asymmetric cooldown conditions and its eventual impact on the current operating emergency procedures (EOPs). Indeed, under off-normal operating conditions, the cooldown of a PWR is performed following prescribed cooldown rates. The accident guidelines impose a maximal linear cooldown rate that allows avoiding steam bubble formation under the reactor vessel head and bringing the reactor cooling system (RCS) to the Residual Heat Removal System (RHRS) entry conditions. However, under specific asymmetric conditions between the cooling loops, NCI may occur during the cooldown phase. This may lead to steam bubble formation in the affected loop, and consequently delays seriously the connection conditions of the RHRS.
The Bel V proposal was to investigate the NCI phenomena under filled and inactive SGs. Several linear cooldown rates and number of affected loops were considered. However, due to the 1D geometry of the downcomer of the PKL test facility [2], a second proposal was made to complement the PKL tests by carrying out experiments in the full 3D ROCOM vessel test facility [3]. Actually, the mixing in the reactor pressure vessel may impact on the overall conditions that lead to the NCI occurrence. In parallel, numerical assessment was carried out using the advanced best-estimate thermal-hydraulic system code CATHARE2/V2.5 developed by CEA, EDF, AREVA, and IRSN [4]. The objective was to evaluate the capabilities of the code in predicting the phenomena that take place in both experiments.
2 EXPERIMENTAL TESTS DESCRIPTION
2.1 PKL Tests Description
The PKL (Primaer KreisLauf) facility [2] is a scaled down mockup of a typical 4-loop 1300-MW Siemens pressurized water reactor (PWR) plant. The facility is built in order to investigate thermal-hydraulic plant behavior under various accident conditions. The primary side is represented by four identical and symmetric loops arranged around the reactor pressure vessel. For each loop, a secondary side is associated, as well as all the significant instrumentation and auxiliary systems.
The objectives of PKL-H4 experiment [2] is to investigate of maximum continuous cooldown rate that still allows maintenance of NC in loops with SGs isolated and water-filled on the secondary sides. It concerns a cooldown phase at a rate of 15 K/h with 3 active SGs and 1 isolated inactive SG.
2.2 ROCOM Test Description
The ROCOM (Rossendorf Coolant Mixing Model) test facility is a 1:5 scaled geometry mock-up of a four-loop nuclear reactor RPV [3]. The facility is built in order to investigate the coolant mixing phenomena in the RPV downcomer and the core inlet zones, as well as the thermal stratification phenomena that may take place in the connecting legs. For this purpose, advanced instrumentation that delivers high-resolution measurement of the mixing phenomena is installed. The RPV downcomer sensors consist of two concentric grids at the inner and outer sides of the downcomer walls. The objective of the ROCOM T1 series [3] is to investigate the mixing in the RPV under asymmetric natural circulation flow conditions of the PKL H4.1 tests. Test T1.1 and test T1.2 assess the mixing in the vessel downcomer of the PKL-H4.1 Run-1 Test, at the beginning of the cooldown phase, and just before the occurrence of the NCI, respectively. The mixing in the downcomer and the core inlet plenum is then measured via the dedicated sensors.
Table-1: Boundary conditions of the PKL-3/ROCOM Runs
|
ROCOM Test |
PKL Test |
Time (s) |
Mass flow rate (kg/s) |
Temperature difference (K) |
|
PKL3T1.1 |
H4.1- Run-1 |
0 |
~1.1 (intact loops) ~0.7 (affected loop) |
~15 |
|
PKL3T1.2 |
H4.1- Run-1 |
~8000 |
~1.15 (intact loops) ~0.3 (affected loop) |
~20 |
3 CALCULATION AND EXPERIMENTAL RESULTS
The CATHARE predictions of the PKL H4.1 Run-1 are shown in Fig.1a and Fig.1b and reflect a good agreement between measured and predicted data. Concerning the mass flow rate in Fig.1a, experimental results show that NCI occurs at about 10000 s after the beginning of the cooldown phase, whereas CATHARE predicts a NCI much later around 30000 s. Nevertheless, good prediction of the other loops mass flow rate is obtained. Fig.1b exhibits the active cold and hot leg temperatures, for which a good agreement with the measurement is obtained.
Concerning the 3D mixing assessment in the ROCOM tests, chosen snapshots of the measured and calculated fluid temperature distributions in the RPV downcomer are sketched in Fig.2, and Fig.3. As it can be seen, the overall temperature distribution is qualitatively well simulated. The descending plume and even the mixing vortices and recirculations in the downcomer are well predicted by the CATHARE code.
4 CONCLUSIONS
In this paper, the capabilities of the current thermal-hydraulic system codes are assessed using experimental data related to the NCI phenomena that may occur during an asymmetric cooldown of the reactor. For this purpose, experimental tests proposed by Bel V within the OECD/NEA PKL-3 project, allowed an assessment of the impact of several cooldown strategies on the NCI occurrence in the PKL test facility. The 3D mixing effects on the NCI which could not be performed in the PKL facility were addressed in the ROCOM installation.
The outcomes of the assessment study show that the results obtained with the CATHARE code are qualitatively in good agreement with the experimental measurements, with an acceptable CPU time. The main phenomena occurring in the vessel downcomer and the cooling loops during the asymmetric natural circulation transient are well predicted.
References
[1] OECD/NEA PKL-3 Project http://www.oecd-nea.org/jointproj/pkl-3.html.
[2] Test Report PKL III H4.1, 2009. Cooldown under natural circulation conditions in presence of secondary side isolated SGs. PTCTP-G/2013/en/001, (2013).
[3] Kliem S., Franz R., OECD PKL3 Project – Final Report on the ROCOM Tests. HZD\FWO\2014\03, 2014.
[4] Lavialle G., CATHARE2_V2.5_2mod8.1, EN/CAD/DER/SSTH/LDLD/EM/NT/ 2010-033/A, 2010.
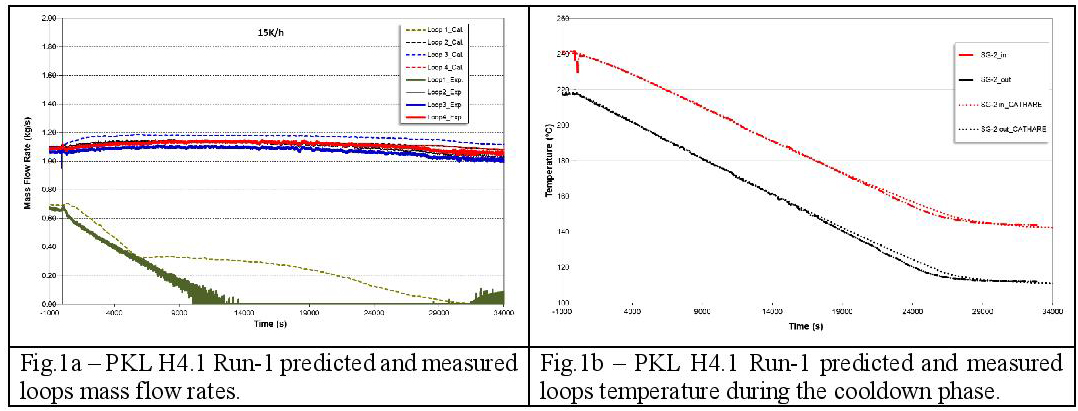
Fig.1b – PKL H4.1 Run-1 predicted and measured loops temperature during the cooldown phase. © Bel V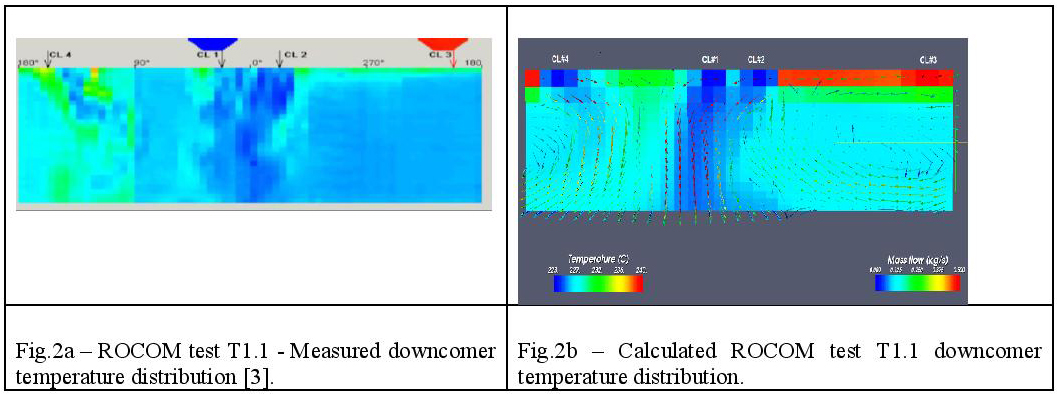
Fig.2b – Calculated ROCOM test T1.1 downcomer temperature distribution. (© Calculated : Bel V)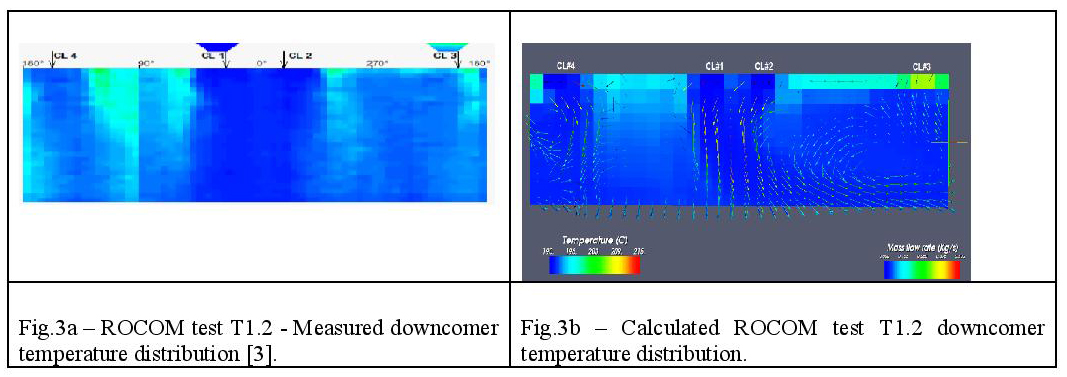
Fig.3b – Calculated ROCOM test T1.2 downcomer temperature distribution. (© Calculated : Bel V)
Anis Bousbia Salah
Bel V
anis.bousbiasalah@belv.be