Award winning work on high-resolution X-ray radiography methods for boiling experiments at high pressure
Background:
Adequate safety is a clear priority in any nuclear reactor design. To guarantee sufficient safety margins during the entire lifetime of the reactor, it is important to follow strict thermal, structural, and oxidation design limits. To estimate safety margins with higher accuracy and decrease the required conservatisms, there is a continuous strive among researchers to develop more advanced experimental techniques that would allow more details measurements of the phenomena of interest, to gain deeper physical insights, so that a better prediction of these design limits can be achieved with state-of-the-art simulation tools. One important topic of interest for the nuclear research community is heat transfer in post-CHF (critical heat flux) flow regimes, when the fuel rods are in contact with a film of steam or with a thinning film of liquid. Accurate prediction of the heat transfer in the presence of such flow regimes, require a very good characterization of the spatial and temporal phase distribution (liquid vs steam) in the coolant channel. This depends on several parameters, such as the system pressure, temperature, heat flux and coolant flow. Since LWRs operate at relatively high pressure, experiments at prototypical conditions require pose several challenges and restrictions on the experimental facilities and the measurement techniques. This is because investigations are needed of phenomena occurring behind thick metal walls. At the same time, it is desired that the instrumentation do not affect the phenomena or, in other words, be not intrusive. Optical methods based on the deployment of lasers and cameras, such as Particle Image Velocimetry, are not applicable due to many factors, such as lack of visual access, the pressure of bubbles, change in refractive index, etc. Conductivity probes are intrusive and hard to install, especially if one wants to measure in areas where walls are heated. Because of these challenges, it was decided to design and build a system that would utilize X-rays and perform measurements of the two-phase by leveraging the fact that X-ray attenuation for water and steam are very different and provide perfect image contrast. To obtain a good data dynamic range and high signal-to-noise ratio, the radiography was performed using the differential imaging method. For this, the experimental section is first imaged when fully filled with water, then when fully filled with steam. These two images are then used as calibration, to convert images of two-phase flows into time-dependent spatial distributions of steam volume-fraction. Because the phenomenon of interest is rapid, it is necessary to acquire the images at a high framerate.
![Photo (left) and schematic diagram (right) of PCHT experimental facility [1,2] © PSI](/sites/default/files/inline-images/art_2-fig_2_PSI.png)
Facility description:
The experimental facility that was used in this work is shown in Figure 2. This flow loop is designed to perform film boiling tests under a pressure range from 0.1 to 6.89 MPa, a mass flux range (in the test section) of 15 to 2,000 kg/m2-s, and the inlet subcooling up to 50ºC. All the components are certified to operate at pressures up to 6.89 MPa and a temperature of 300ºC. The test section consists of a vertical 1.55 m long Incoloy-800H cylindrical tube with internal diameter of 19.05 mm, wall thickness of 3.05 mm and is encased in silicon-based microporous insulation. Three DC-power supplies apply a maximum power of up to 34 kW to the heated section. The flow direction is directed upward against gravity.
Challenges of high-temperature conditions on X-ray measurements:
X-ray transmission-based measurements at high temperatures and pressure pose a number of challenges that have to be overcome. These are mostly associated with changes in material properties and geometry as a consequence of thermal expansion. The influence of these temperature-dependent effects needs to be considered to obtain quantitatively meaningful results. In this work we have accounted for the following:
- Accounting for the differences in temperature between calibration images and experimental flow conditions. This is because fluid and materials temperatures affect the absorption coefficients for X-rays;
- Beam hardening corrections, to take into account the fact that low-photon energies can be completely absorbed within the test section, leading to a change in the spectrum of the energy distribution between source photons and measured photons at the detector location.
- Density correction to take into account the effect of fluid and material density variations on photon absorption coefficients.
- Thermal expansion to account for the effects of thermal expansion on the geometry of the experimental setup.
The mathematical formulations to correct for all these effects are detailed in the paper [3].
Obtained results.
The developed correction methods were applied to obtained X-ray images for two flow conditions:
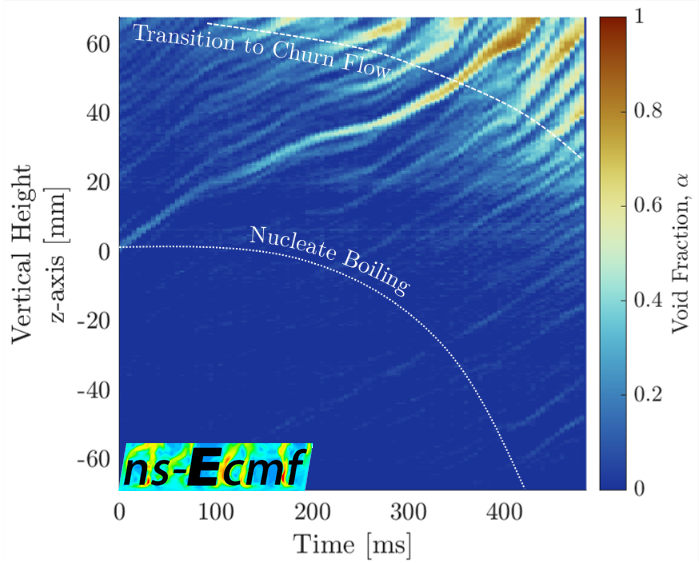
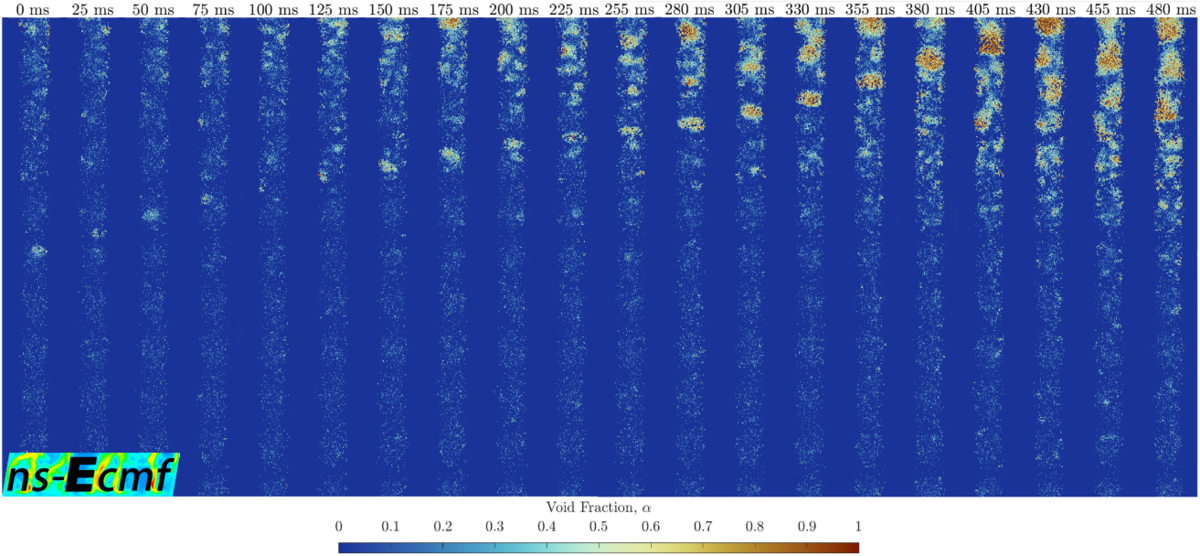
Transition from Nucleate Boiling to Churn Flow Regime (see Figure 3 and Figure 4).
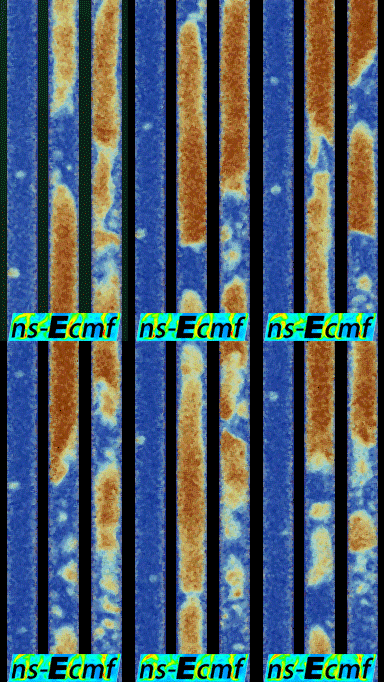
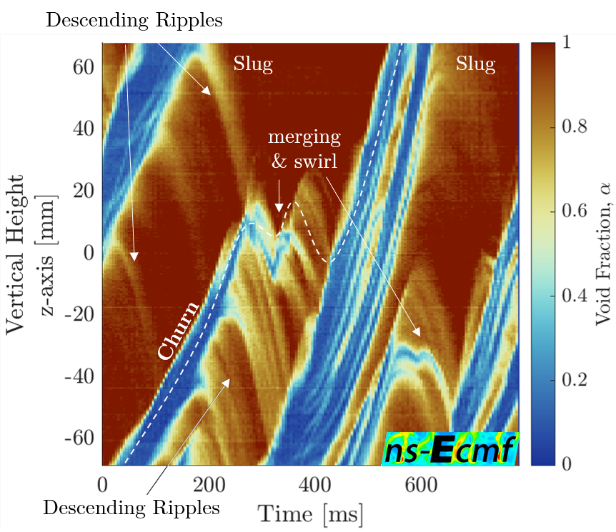
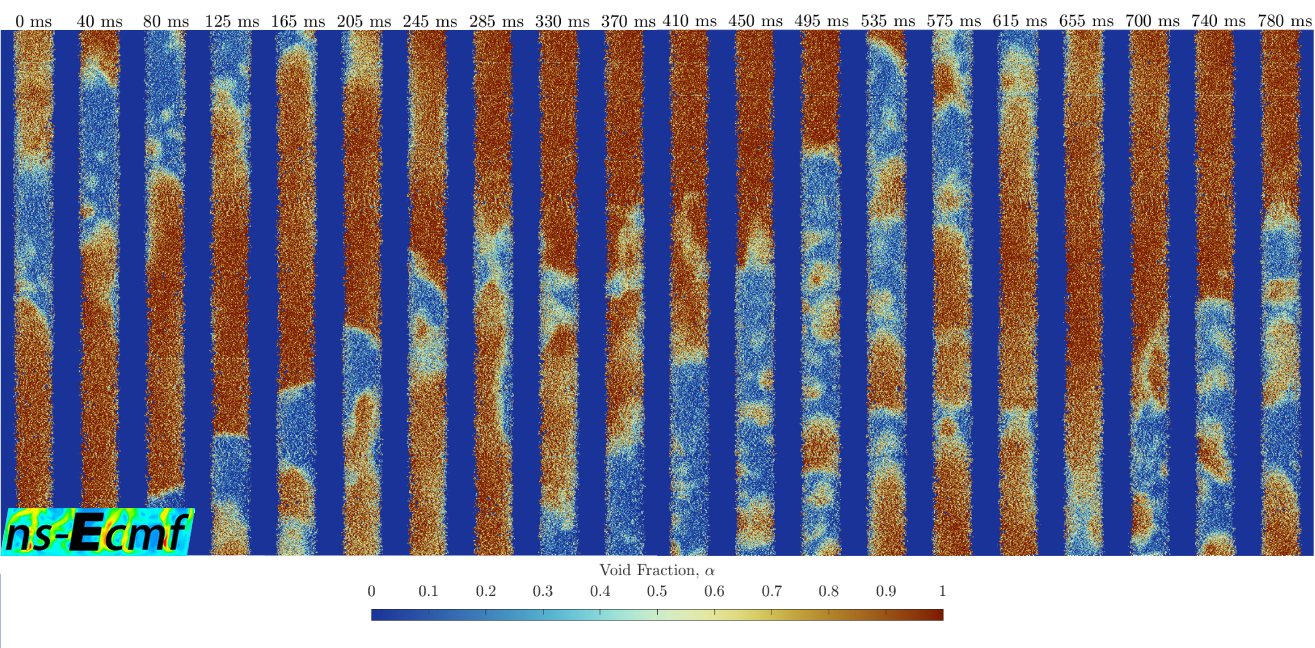
Slug-Churn Flow Regime (see Figure 5 and Figure 6)
The first pair of resulting images (see Figure 3and Figure 4) shows the evolution of Nucleate boiling and its transition to churn flow. First, bubbles appear closer to the middle of the imaging field, and then the boiling front, over time, propagates downward. Finally, as the number of bubbles increases, they merge into larger bubbles, called churn bubbles which eventually merge into even larger bubbles, so-called Taylor bubbles.
The next pair of images (see Figure 5 and Figure 6) shows the dynamics of the slug-churn regime. Here Taylor bubbles traverse the test section, followed by churn flow in their wake. Here one can see a swirl-like motion most prominently at the head of the Taylor bubbles and the irregular-shaped medium-sized bubbles; this effect is distinctively observed at the bottom of the measured section from the frames at times 125 ms - 370 ms.
|
|
These two flow patterns demonstrate the data quality and resolution that could be achieved with the newly constructed imaging system and image processing algorithms. Such a resolution would allow building a high-fidelity experimental database to validate not only subchannel codes but also high-fidelity codes like Computational Fluid Dynamics (CFD).
Professor Andreas Pautz
PSI
andreas.pautz@psi.ch
Professor Thomas Justus Schmidt
PSI
thomasjustus.schmidt@psi.ch
